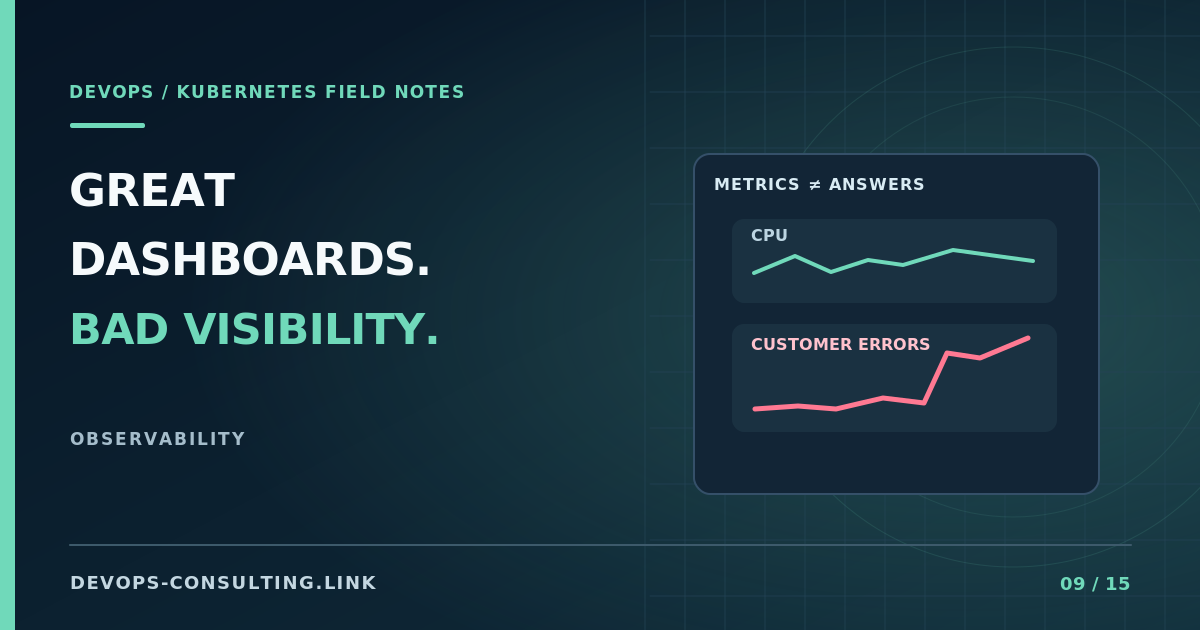
CPU panels. Memory graphs. Pod counts. A beautiful Grafana dashboard on a big office screen.
Then customers report slow checkouts, and the team spends forty minutes trying to decide whether the issue is application code, DNS, a database, or a third-party API.
Data collection is not the same thing as operational understanding.
The dashboard test
Take your most important service and ask three questions:
- Are customers currently having problems?
- Which requests and dependencies are responsible?
- What should the on-call engineer do next?
If you cannot answer those with your existing signals, more dashboard panels probably won't help.
Start with the service, not the nodes
For a user-facing API, start with request rate, errors, and duration. Add saturation signals appropriate to the system: worker queues, connection pools, database limits, or CPU contention. Use an SLO where the business needs a measurable reliability target.
Node and Kubernetes metrics are still important. They help explain why the service is unhealthy. They should not be the only way to discover it.
An example: a pod can consume modest CPU while every request waits on an unavailable dependency. A CPU dashboard looks calm. Customer latency is terrible.
Three improvements that pay off quickly
1. Link metrics, logs, and traces. An error-rate spike should lead to the responsible service, logs with a correlation identifier, and a trace showing where the time was spent. You do not need distributed tracing everywhere on day one.
2. Alert on actionable conditions. Page when customer impact needs immediate intervention. Route lower-priority anomalies to tickets or working-hours review. Alert severity should reflect urgency, not how impressive the graph looks.
3. Make dashboards incident-oriented. A useful dashboard can answer "what changed?", "what is failing?", and "which dependency is the bottleneck?" without knowing the author's mental model.
Measure the on-call experience
During your next incident review, ask how long it took to detect, identify, and mitigate the problem. Note which dashboards were used and which ones were ignored. Remove unused noise. Add missing context where it would have shortened diagnosis.
I've written a separate guide to Kubernetes signals that actually matter. This article is about judging the observability system by its use during incidents instead of its visual polish.
Discussion: What's the most impressive Grafana dashboard you've seen that turned out to be useless during an outage?
If production incidents still require guesswork, see Kubernetes observability consulting or request a discovery call.